
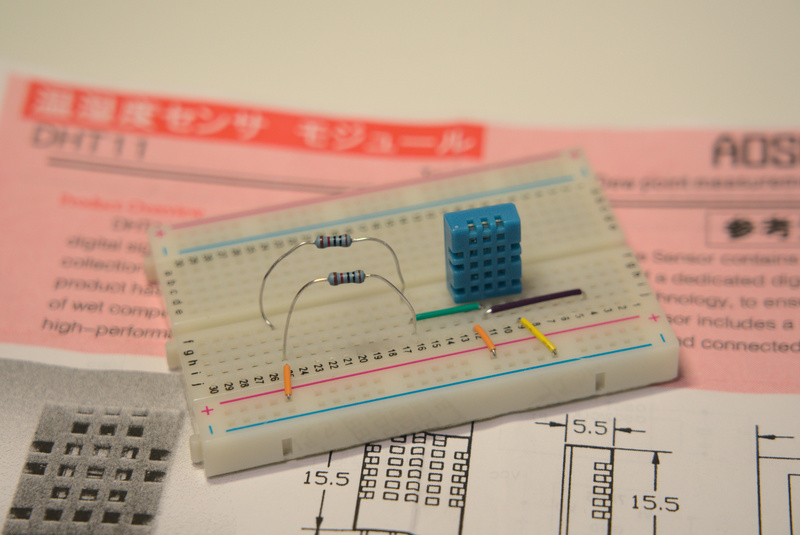
前回に引き続き照度測定に使えそうな部品の導入です。今回は高精度を謳う温湿度センサモジュール DHT11 (秋月通販コード M-07003)です。
データシートからの概要から The product has high reliability and excellent long-term stability という凄い言葉が並んでいます。
仕様面も excellent quality, fast response, precise calibration と自信満々で少し笑えてきますね ?
使い方は簡単ですが注意点として、電源 3.5V で運用する場合は電圧降下によって計測精度が落ちるので 20cm よりも長いケーブルを使用しないようにという注意書きがあります。
それから電源ケーブルが 20m (※20cmではない) 未満の場合には 5.1kΩ プルアップ抵抗を信号出力ピンに接続しておくことが推奨とされています。
10kΩ の抵抗を並列に繋いでおくと 5kΩ になりますので 10kΩ の抵抗が2つあれば簡単です。と言うか(有り合わせの材料で再現してるので)私の手持ちの抵抗で 5kΩ を作れそうなのが他にないのでこうしてます。
R = (10**4 * 10**4) / (10**4 + 10**4) = 5 * 10**3 = 5k
こんな感じで 5kΩ を作れれば何でも良いです。不安な場合は接続した抵抗にテスタを当てて測定してみてください。
推奨では 5.1kΩ になっていますが 10**2 / 5.1*10**3 ≒ 2% なので誤差 ±5% は許容範囲と考えると、これで良いんじゃないかなと個人的には思います。
接続ができましたら Arduino IDE を立ち上げてキーボードの CTRL + Shift + i を同時に押して Library Manager を起動させます。
そのまま Adafruit の DHT-sensor-library (ver 1.4.1) をインストールすれば、直ぐに使えるようになります。
#include "DHT.h"

// these constants describe the pins. They won't change.
#define DHTPIN 2

// this constant describes the DHT type. They won't change.
#define DHTTYPE DHT11

unsigned long myTime;
unsigned int mySec;

DHT dht(DHTPIN, DHTTYPE);

void setup() {
  Serial.begin(9600);
  Serial.println(F("DHT11 test starts!"));
  dht.begin();
}

void loop() {
  // Wait a few seconds between measurements.
  delay(2000);
  myTime = millis(); //returns the number of milliseconds passed since started
  mySec = int(myTime/1000);

  // Reading temperature or humidity takes about 250 milliseconds!
  // Sensor readings may also be up to 2 seconds 'old' (its a very slow sensor)
  float h = dht.readHumidity();
  // Read temperature as Celsius (the default)
  float t = dht.readTemperature();
  // Read temperature as Fahrenheit (isFahrenheit = true)
  float f = dht.readTemperature(true);

  // Check if any reads failed and exit early (to try again).
  if (isnan(h) || isnan(t) || isnan(f)) {
    Serial.println(F("Failed to read from DHT sensor!"));
    return;
  }

  // Compute heat index in Fahrenheit (the default)
  float hif = dht.computeHeatIndex(f, h);
  // Compute heat index in Celsius (isFahreheit = false)
  float hic = dht.computeHeatIndex(t, h, false);

  Serial.print(mySec);
  Serial.print("\t");
  Serial.print(F("Humidity: "));
  Serial.print(h);
  Serial.print(F("%  Temperature: "));
  Serial.print(t);
  Serial.print(F("°C "));
  Serial.print(f);
  Serial.print(F("°F  Heat index: "));
  Serial.print(hic);
  Serial.print(F("°C "));
  Serial.print(hif);
  Serial.println(F("°F"));
}
ハイライトしたのは経過時間を計測するために私が書き足した部分で、基本的にはサンプルスケッチのままで問題ありません。
実行したまま CTRL + Shift + m キーを同時に押すと Serial Monitor が表示され次のような文字列の羅列が延々と表示されるはずです。
2414 Humidity: 39.00% Temperature: 22.30°C 72.14°F Heat index: 21.60°C 70.89°F
2416 Humidity: 39.00% Temperature: 22.30°C 72.14°F Heat index: 21.60°C 70.89°F
2418 Humidity: 39.00% Temperature: 22.30°C 72.14°F Heat index: 21.60°C 70.89°F
これを1時間ほど実行したものをテキストファイルに書き出してグラフ化したものが次のようになります。1分間 = 60秒 なので 3600 秒で実行開始から1時間分の記録になります。
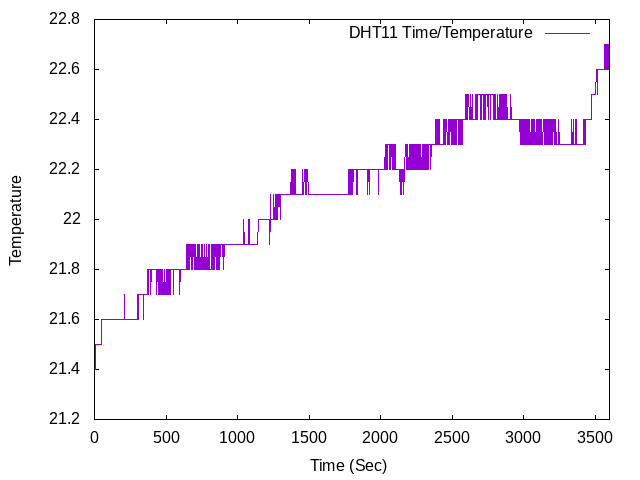
安定していていいですね。そもそも、わざわざ新しいセンサを初めて試してみたのは LM35DZ があまり安定していなくて、ついでに温度を計測する意義を感じられなかったからです(下の動画参照)。
これぐらい安定しているなら、バッテリの動作時間を計測するときに参考ぐらいにはなるので次からは積極的にこちらを使おうかと思いました。
このグラフをどうやって作ったの思われた方、Serial Monitor の出力をテキストファイルに書き出す方法は以前にこちらの記事に書いたので必要に応じて参照されてください。
ただ出力ファイルのままでは使いにくいので再利用しやすく成形してます。測定はじめてから気づいたので、プログラム実行前に調整しておけばこの作業は必要ありません。
今回はやってしまって後から気づいたので Linux の便利コマンドを利用します。
$ cat dht.csv | sed -e 's/\s\|%\|°\|C/,/g'|cut -d , -f 1,3,7,15 > output.txt
$ tail -n 1 output.txt
あとは gnuplot で描き出すだけです。
gnuplot> reset
gnuplot> set datafile separator ","
gnuplot> set ytics
gnuplot> set xtics
gnuplot> set autoscale y2fix
gnuplot> set ylabel "Temperature"
gnuplot> set xlabel "Time (Sec)"
gnuplot> set xrange[0:3600]
gnuplot> set output "output_temp.png"
gnuplot> plot "output.txt" using 1:3 title "DHT11 Time/Temperature" w lines
湿度のグラフも同じように作れます。
gnuplot> reset
gnuplot> set datafile separator ","
gnuplot> set ytics
gnuplot> set xtics
gnuplot> set autoscale y2fix
gnuplot> set ylabel "Humidity"
gnuplot> set xlabel "Time (Sec)"
gnuplot> set xrange[0:3600]
gnuplot> set output "output_temp.png"
gnuplot> set output "output_humid.png"
gnuplot> plot "output.txt" using 1:2 title "DHT11 Time/Humidity" w lines